Test of Statistical Significance in SAS

Many materials are available for a test of statistical significance. This blog provides you with a short idea of why, what, when, and how to use statistical test?. Also, this blog post is an attempt to a quick revision of the usage of these statistical tests. p-value and hypothesis were not discussed in this blog and you can check here.
Why do we need many Statistical tests?

For example, we want to measure the weight of the ball. We have a four-choice of devices to measure like Physical balance, thermometer, ruler and volumetric flask. Which one do we select? Obviously, we select physical balance. Isn’t it? Suppose if we want to measure the temperature of the ball? Then we select thermometer. For volume, then we select volumetric flask.
Now, you can see that as the variable which we want to measure changes, then device also changes. The same way why do we have so many statistical tests? We have a different type of variables and analysis. As the type of analysis changes, then the statistical tests also changes.
Let’s take another example, suppose Teacher want to compare the height of boys and girls in the class.

So Teacher generates Null and Alternative Hypothesis. Here,
Null Hypothesis(H0) → Height of boys and girls are similar and any difference observed between the heights is by chance.
Alternative Hypothesis (H1) → Height of boys is higher than the height of girls so observed differences between height is real.
How to verify this hypothesis? For this purpose, a test of statistical significance plays a role.
What is Test of statistical significance?
These are the test that helps the researchers or analyst to confirm the Hypothesis. In other words, these tests help whether the hypothesis is true or not?
There are a lot of statistical tests. But, we will see two types in this blog.
Test of statistical significance divided into two types.
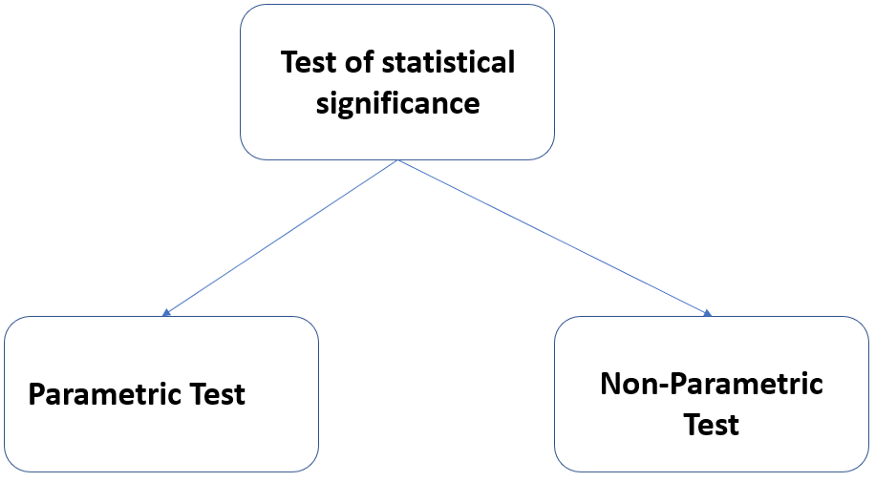
Next question, when to use?
Choosing a Statistical test
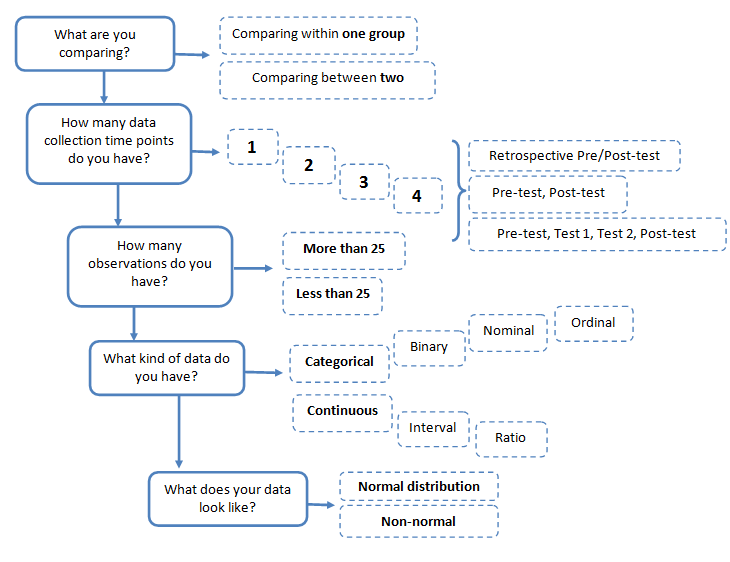
Both Parametric and Non-Parametric has different kinds of tests (different types of parametric test was covered below), but how does an analyst or researcher choose the right test based on the research design, variable type, and distribution?
The chart below provides a summary of the questions that need to be answered before the right test can be chosen. Reference: University of Minnesota. You can check here.
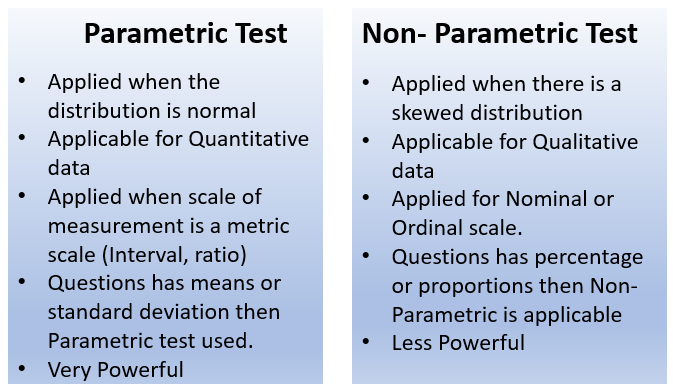
What is Parametric Test?
It is used if the information about the population is completely known by means of its parameters then the statistical test is called a parametric test.
Types of Parametric Test
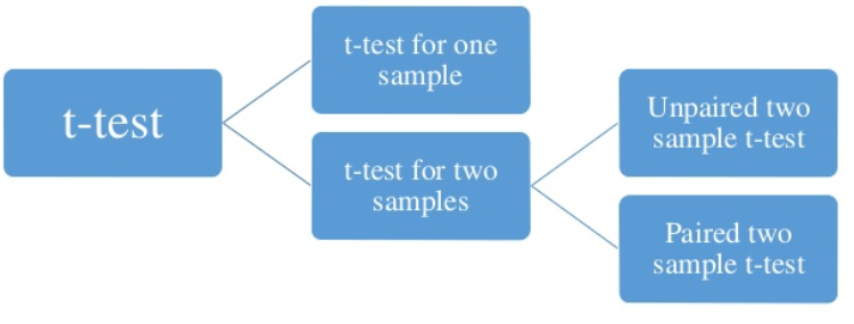
1) t-Test
t-Test for one sample
A t-test compares the difference between two means of different groups to determine whether the difference is statistically significant
Let’s take an example of hbs2 dataset. The dataset contains 200 observations from a sample of high school students. It has gender, socio-economic status, ethnic background, subject scores like reading, writing, mathematics, social studies.
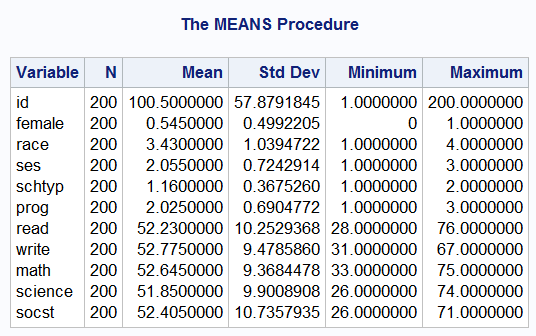
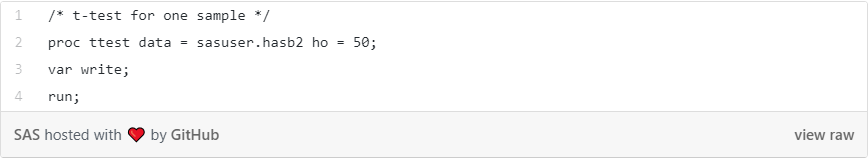
Here, would like to test whether the average writing score differs significantly from 50.
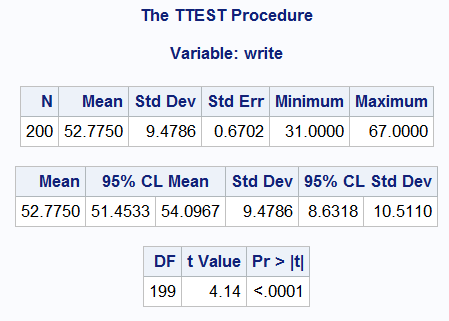
Here, a p-value is less than 0.05. Hence, the mean of the variable write for this sample of students is 52.77, which is statistically significantly different from the test value of 50. We would conclude that this group of students has a significantly higher mean on the writing test than 50.
t-Test for two samples
It is used when the two independent random samples come from the normal populations having the unknown or the same variance. It divided into two types
- Independent Two-Sample T-Test:
An independent samples t-test is used when you want to compare the means of a normally distributed interval dependent variable for two independent groups. In other terms, this t-test is designed to compare means of the same variable between the two groups.
Here, we would like to test whether the mean for writing is the same for males and females. (female is a variable which has 0 and 1 ( 0 -> Male and 1 -> Female) .This variable is necessary for doing the independent group t-test and is specified by the class statement.
In our dataset, we compare the mean writing score between the group of female students and the group of male students (Mentioned as a class in the above code and female is a variable( 0 -> Male and 1 -> Female). This gives two possible different t-statistic and two different p-values. Interpretation of p-value is the same as other t-tests.
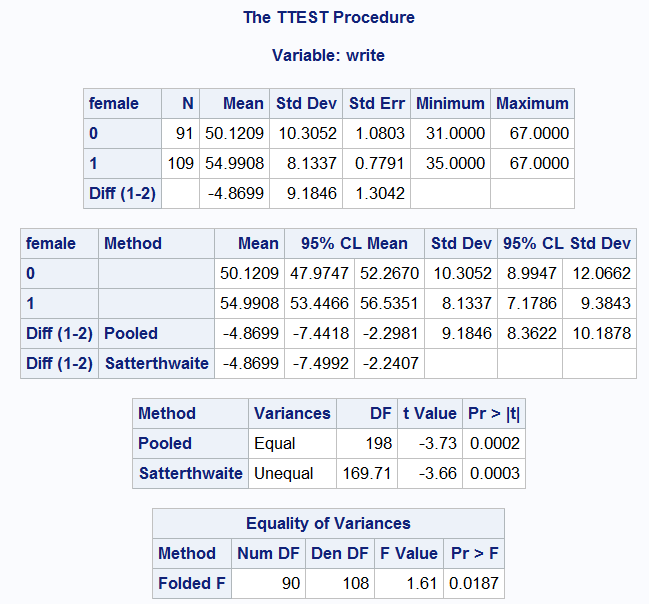
From the above equality of variances, a p-value is 0.0187 which is less than 0.05, we conclude that variances are significantly different. The above result shows that there is a statistically significant difference between the mean writing score for males and females (t = -3.73, p = .0003). In other words, females have a statistically significantly higher mean score on writing (54.991) than males (50.121).
2. Paired two-sample t-Test
It is used when you have two related observations (i.e., two observations per subject) and you want to see if the means on these two normally distributed interval variables differ from one another.
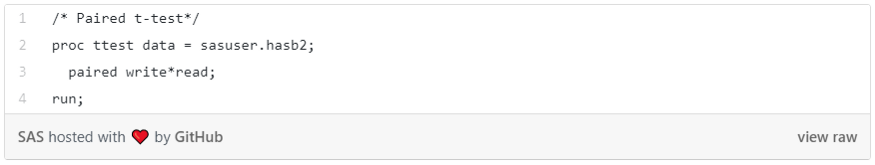
Checking writing and reading
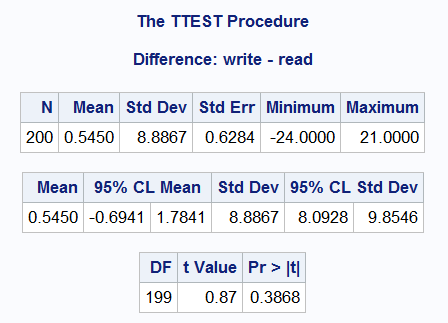
A p-Value is > 0.05. The above result shows that the mean of reading is not statistically significantly different from the mean of writing.
2) Z-Test
Z-test is a statistical test where normal distribution is applied and is basically used for dealing with problems relating to large samples when the frequency is greater than or equal to 30. It is used when population standard deviation is known. If the sample size is less than 30 then t-test is applicable.
In SAS proc t-test will take care of the sample size and gives results accordingly. There is no sperate code for z test in SAS.
3) Analysis of Variance (ANOVA)
It is a collection of statistical models used to analyse the differences between group means or variances.
One-way ANOVA
A one-way analysis of variance (ANOVA) is used when you have a categorical independent variable (with two or more categories) and a normally distributed interval dependent variable and you wish to test for differences in the means of the dependent variable broken down by the levels of the independent variable.
In SAS it is done using PROC ANOVA
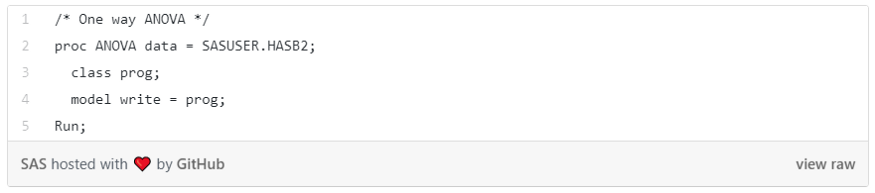
Here, would like to test whether the mean of writing differs between the three program types (prog). Prog is a category variable.
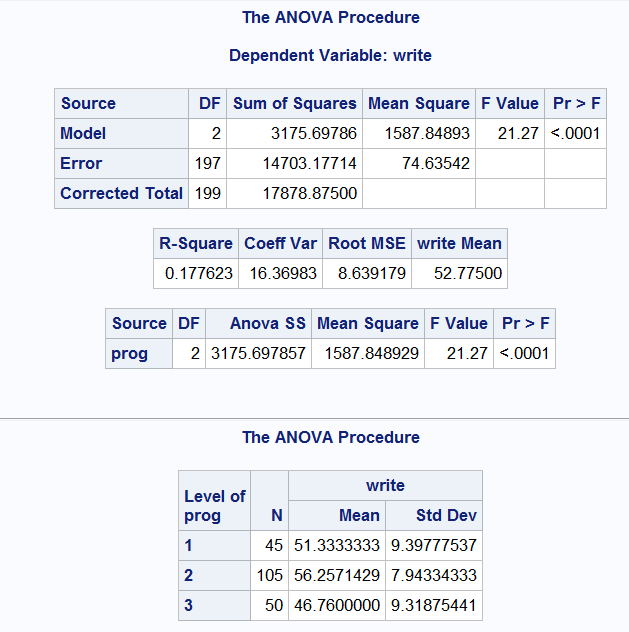
The mean of the dependent variable (writing) differs significantly among the levels of program type. However, we do not know if the difference is between only two of the levels or all three of the levels. We can also see that the students in the academic program (level of prog 2 -> Academic program) have the highest mean writing score, while students in the vocational program have the lowest. (level of prog 1 -> Vocational)
Two-way ANOVA
Two-way ANOVA is a type of study design with one numerical outcome variable and two categorical explanatory variables.
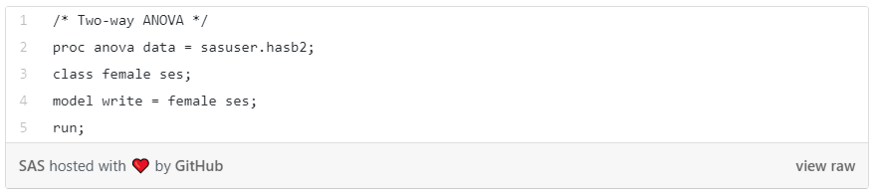
Here, write as the dependent variable and female and socio-economic status (ses) as independent variables. We would like to check writing differs between the female and ses.
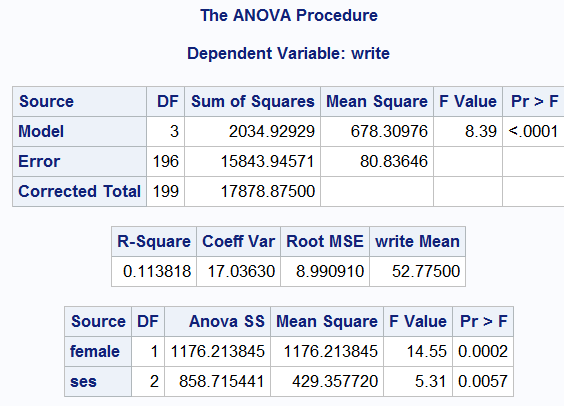
These results indicate that the overall model is statistically significant (F = 8.39, p = 0.0001). The variables female and ses are statistically significant (F = 14.55, p = 0.0002 and F = 5.31, p = 0.0057, respectively).
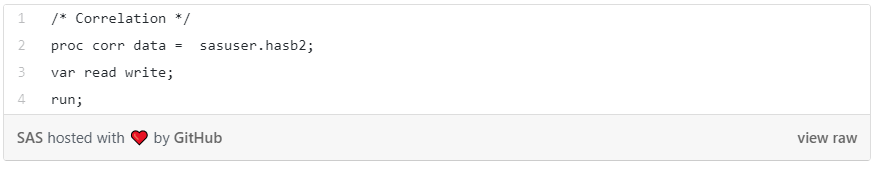
4) Pearson’s Correlation (r)
A correlation is useful when you want to see the linear relationship between two (or more) normally distributed interval variables.
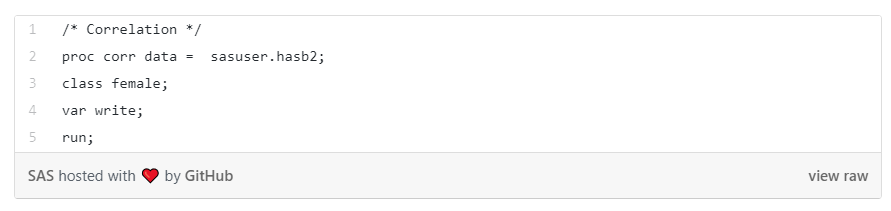
We can run a correlation between two continuous variables read and write in our dataset
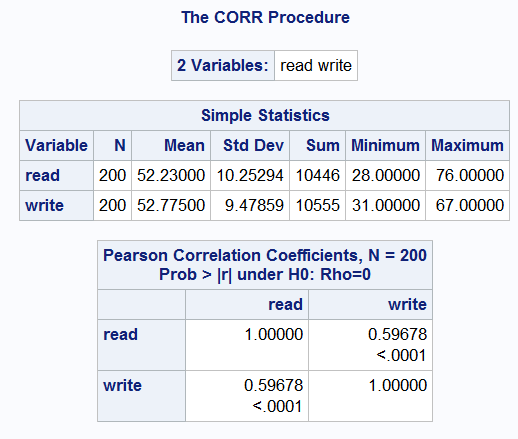
We can see that the correlation between read and write is 0.59678. By squaring the correlation and then multiplying by 100, we can find out what percentage of the variability is shared. Let’s round 0.59678 to be 0.6, which when squared would be .36, multiplied by 100 would be 36%. Hence read shares about 36% of its variability with write.
I will explain the Non-Parametric test in my next article.
Keep learning and stay tuned for more!
Reference: