Five Cool Python Libraries for Data Science


Python is a best friend for the majority of the Data Scientists. Libraries make their life simpler. I have come across five cool Python libraries while working on my NLP project. This helped me a lot and I would like to share the same in this article.
1. Numerizer
Amazing library to convert text numerics into int and float. Useful library for NLP projects. For more details, please check PyPI and this github repo.
Installation
!pip install numerizerExample
#importing numerize library from numerizer
import numerize
#examples
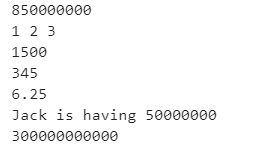
print(numerize(‘Eight fifty million’))
print(numerize(‘one two three’))
print(numerize(‘Fifteen hundred’))
print(numerize(‘Three hundred and Forty five’))
print(numerize(‘Six and one quarter’))
print(numerize(‘Jack is having fifty million’))
print(numerize(‘Three hundred billion’))Output
2. Missingo
It is widespread to find missing values in a real-world dataset. We need to understand the missing values before imputing. Missingo offers a quick and helpful way to visualize the missing values.
Installation
!pip install missingno

Usage#
importing necessary libraries
import pandas as pd
import missingno as mi

# reading the dummy dataset

data = pd.read_excel(“dummy.xlsx”)

# checking missing values

data.isnull().sum()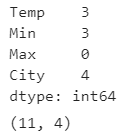
Dummy dataset has 11 rows and four columns. Missing values presented in Min, Temp, and city variables. We can visualize using a bar graph and matrix. It also supports heatmap, dendrogram. For more details, please check this Github repository.
#Visualizing using missingo

print(“Visualizing missing value using bar graph”)
mi.bar(data, figsize = (10,5))

print(“Visualizing missing value using matrix”)
mi.matrix(data, figsize = (10,5) )
Output
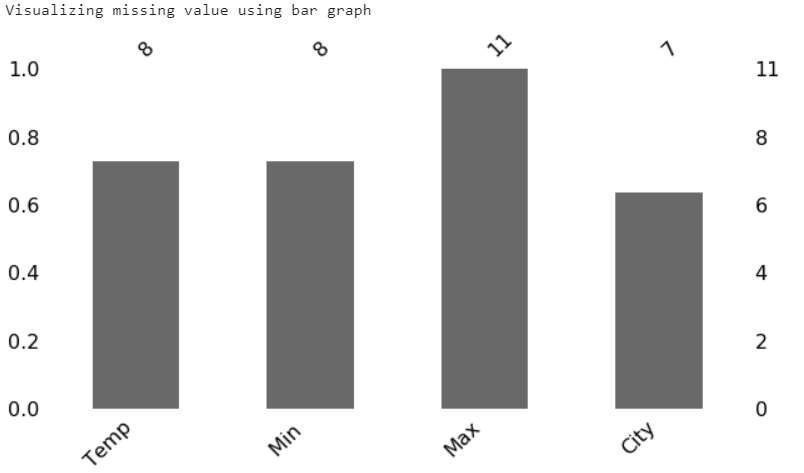
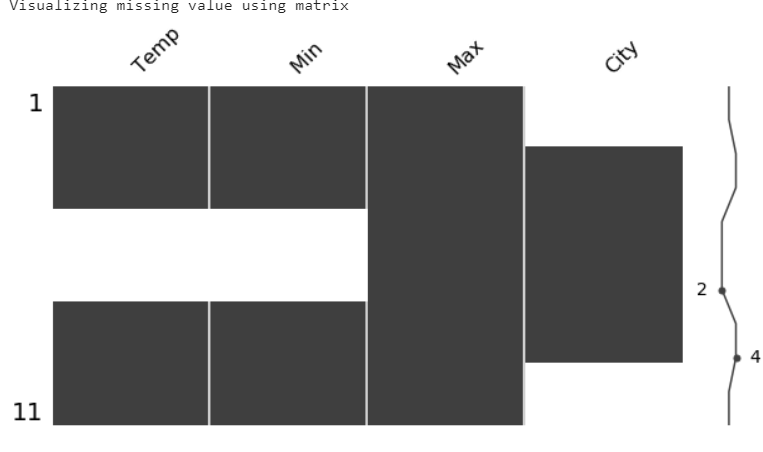
We can see the missing values in temp, min, and city from the above bar graph and matrix.
3. Faker
We might come across a situation where we need to generate some test data or use some dummy data in our analysis. One way to get dummy data is by using the Faker library. This will generate fake data for you very quickly when you need to.
Installation
!pip install fakerExample
# Generating fake email
print (fake.email())

# Generating fake country name
print(fake.country())

# Generating fake name
print(fake.name())

# Generating fake text
print(fake.text())

# Generating fake lat and lon
print(fake.latitude(), fake.longitude())

# Generating fake url
print(fake.url())

# Generating fake profile
print(fake.profile())

# Generating random number
print(fake.random_number())
Output
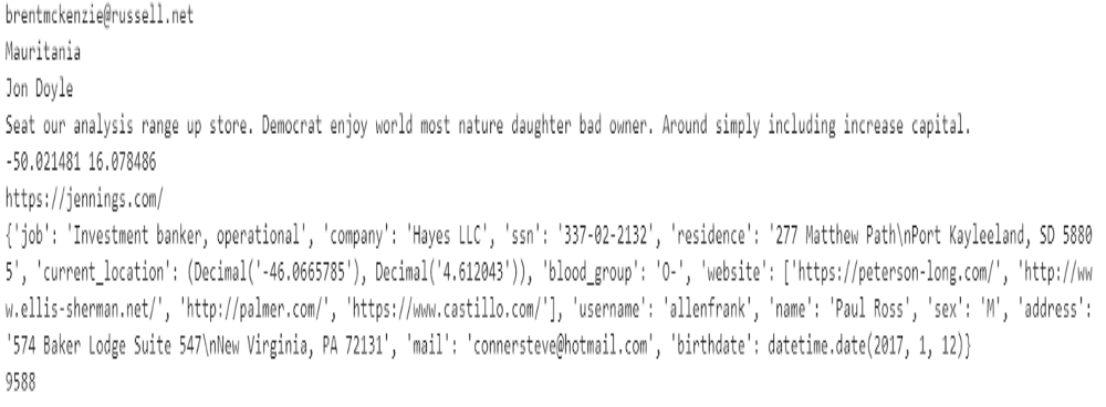
It generates fake data for various categories, and please check this link for more details.
4. EMOT
Collecting and analyzing data on emojis as well as emoticons give useful insights, especially in sentiment analysis. An emoji is an image small enough to insert into text that expresses an emotion or idea. An emoticon is a representation of a human facial expression using only keyboard characters such as letters, numbers, and punctuation marks.
Emot helped us to convert the emojis and emoticons into words. For more details on this library, please check this Github repo. It has a good collection of emoticons and emojis with the corresponding words.
Installation
!pip install emotUsage
#Importing libraries
import re
from emot.emo_unicode import UNICODE_EMO, EMOTICONS

# Function for converting emojis into word
def convert_emojis(text):
    for emot in UNICODE_EMO:
        text = text.replace(emot, "_".join(UNICODE_EMO[emot].replace(",","").replace(":","").split()))
    return text

# Example
text1 = "Hilarious 😂. The feeling of making a sale 😎, The feeling of actually fulfilling orders 😒"
convert_emojis(text1)
Output
‘Hilarious face_with_tears_of_joy. The feeling of making a sale smiling_face_with_sunglasses, The feeling of actually fulfilling orders unamused_face’
Emoticon into word form
Usage#
# Function for converting emoticons into word

def convert_emoticons(text):
    for emot in EMOTICONS:
        text = re.sub(u'('+emot+')', "_".join(EMOTICONS[emot].replace(",","").split()), text)
    return text# Example
text = "Hello :-) :-)"
convert_emoticons(text)
Output
'Hello Happy_face_smiley Happy_face_smiley'
5. Chartify
Chartify is a visualization library that aims to make it as easy as possible for data scientists to create charts. It comes with user-friendly syntax and consistent data formatting compared to other tools. It takes less time to create beautiful and quick charts. This was developed by Spotify labs.
Here, I am showing only the bar chart. For more details and charts, please check this documentation and notebook
Installation
!pip install chartifyUsage
# importing necessary library

import numpy as np
import pandas as pd
import chartify

#loading example dataset from chartify

data = chartify.examples.example_data()
data.head()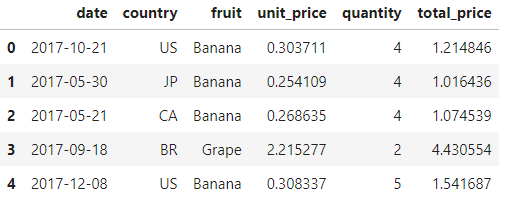
# Calculating total quanity for each fruits

quantity_by_fruit = (data.groupby(‘fruit’)[‘quantity’].sum().reset_index())
ch = chartify.Chart(blank_labels=True, x_axis_type=’categorical’)
ch.set_title(“Vertical bar plot”)
ch.set_subtitle(“Automatically sorts by value counts.”)
ch.plot.bar(
 data_frame=quantity_by_fruit,
 categorical_columns=’fruit’,
 numeric_column=’quantity’)
ch.show()
Output
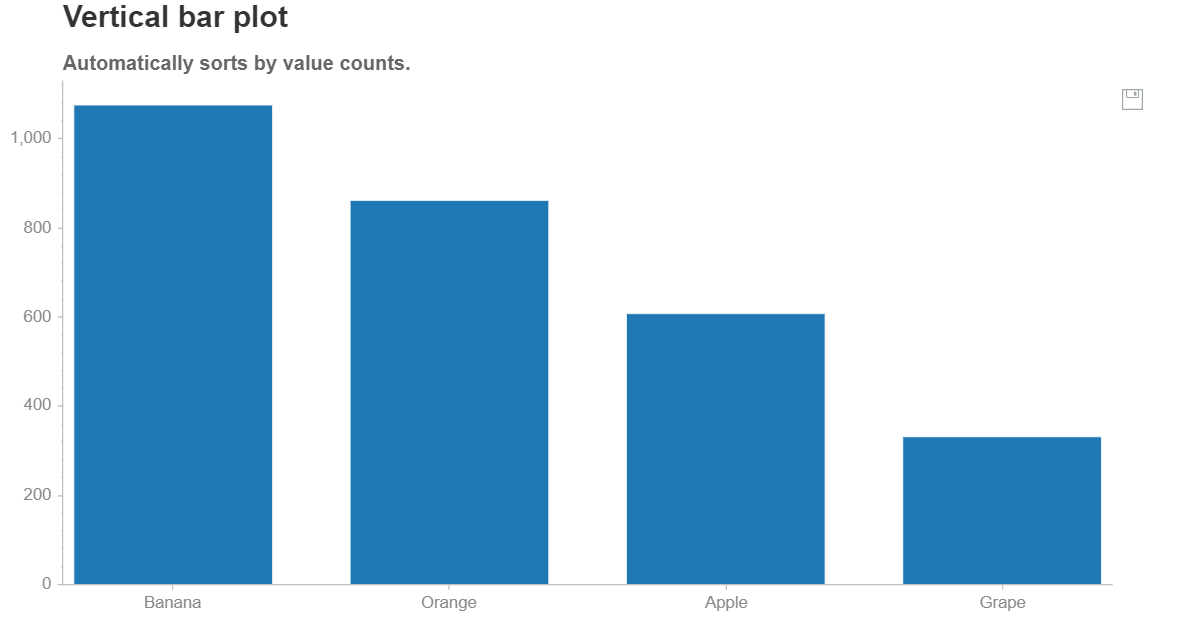
You can save the chart by clicking the save icon at the top right of the chart.
Thanks for reading. If you have anything to add, please feel free to leave a comment!
You can also read this article on KDnuggets.