Exploring Indian Premier League with Interactive Visualizations

The art and practice of visualizing data is becoming ever more important in bridging the human-computer gap to mediate analytical insight in a meaningful way.
―Edd Dumbill
INTRODUCTION
Indian Premier League (IPL), Indian professional Twenty 20 (T20) cricket league established in 2008. The league, which is based on a round-robin group and knockout format, has teams in major Indian cities.
This is an exploration of IPL data visualization challenge (2008–2018) available in machinehack.com. I have done the visualization using Tableau.
ABOUT THE DATA
The dataset contains the following information from 2008 to 2018.
- Match_date — Date and year of the match
- Match_number — Number of the match for each season
- Macth_venue — Stadium name and location
- Match_time — Night or Day/night
- Toss_winner — Team name who won the toss
- Toss_Decision — Decision whether to bat or field
- Team1 — Team who bat first
- Team1_score — Team 1 score
- Team 2 — Team who bat second
- Team2_score — Team 2 score
- Winning_team — Team who won the match
- Winning_margin — How many runs or wickets each team won?
In this article, we sought to understand IPL teams, matches and winning pattern through visualizations. I have done the preliminary analysis using this dataset, but a lot can be done.
Following are the steps followed for analysis:
Read data, pre-processing and cleanup of data in Python. The complete source code is available here, in case you want to have a look.
I made a good amount of worksheets with visualizations exploring various aspects of the data in Tableau. Medium doesn’t give us an option to embedded HTML or javascript code, hence what you see in this blog is a screenshot. However, all my visualizations and dashboards can be seen here
Interactive visualizations and analysis
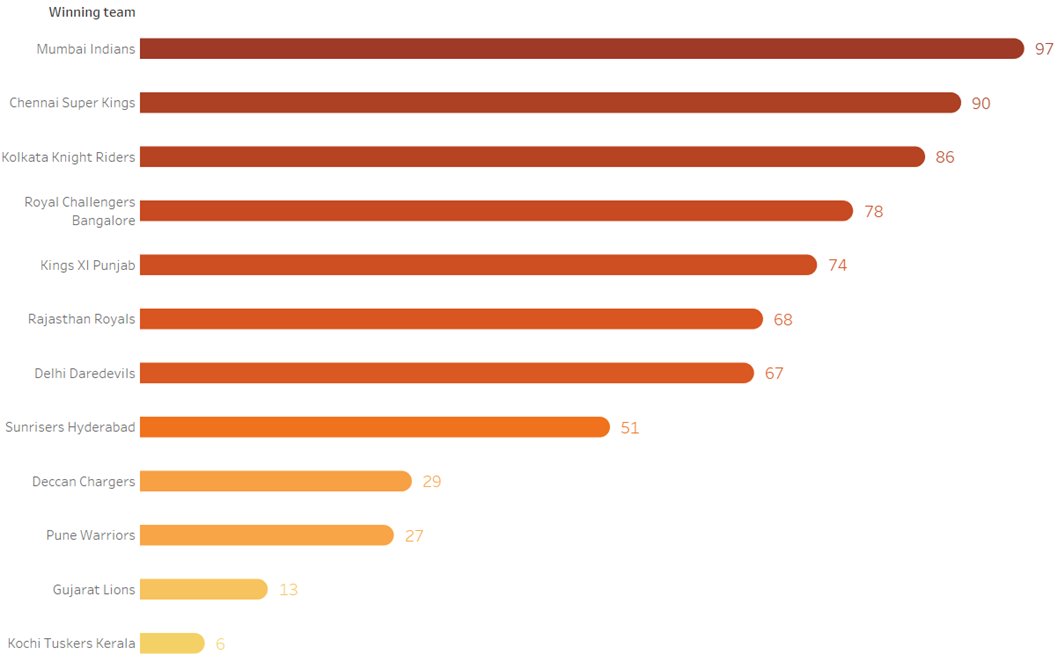
Who is the most winning IPL Team?
From this rounded bar graphs, we can see that Mumbai Indians and Chennai Super Kings are the most successful teams in the IPL history followed by Kolkata Night Riders. Mumbai Indians won 97 matches, Chennai Super Kings won 90 matches and Kolkata Knight Riders won 86 match from 2008 to 2018.
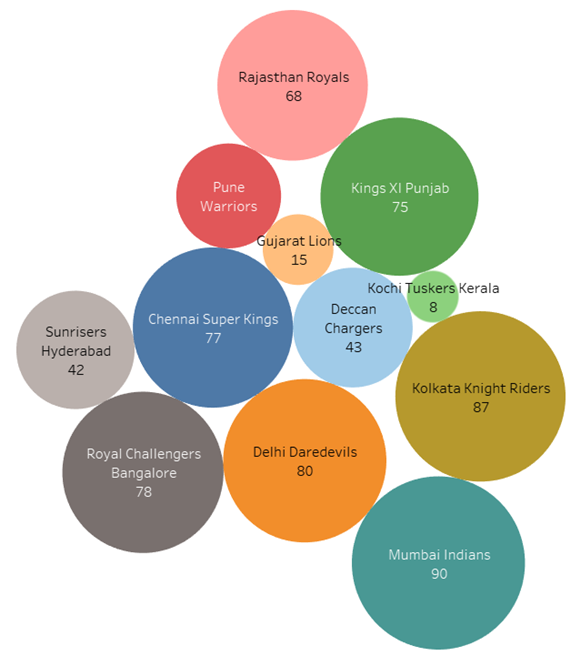
Top Toss winners in IPL seasons?
From this packed bubbles, it can be seen that Mumbai Indians won the highest tosses in the IPL followed by Kolkata Night Riders and Delhi Daredevils.
A number of matches played across India?
The below map shows that a number of matches played across India. The highest number of matches were played in Mumbai, Kolkata, Bangalore and Delhi. Also, season 2009 and 2014 happened in South Africa and UAE and the same was not shown in the below map.

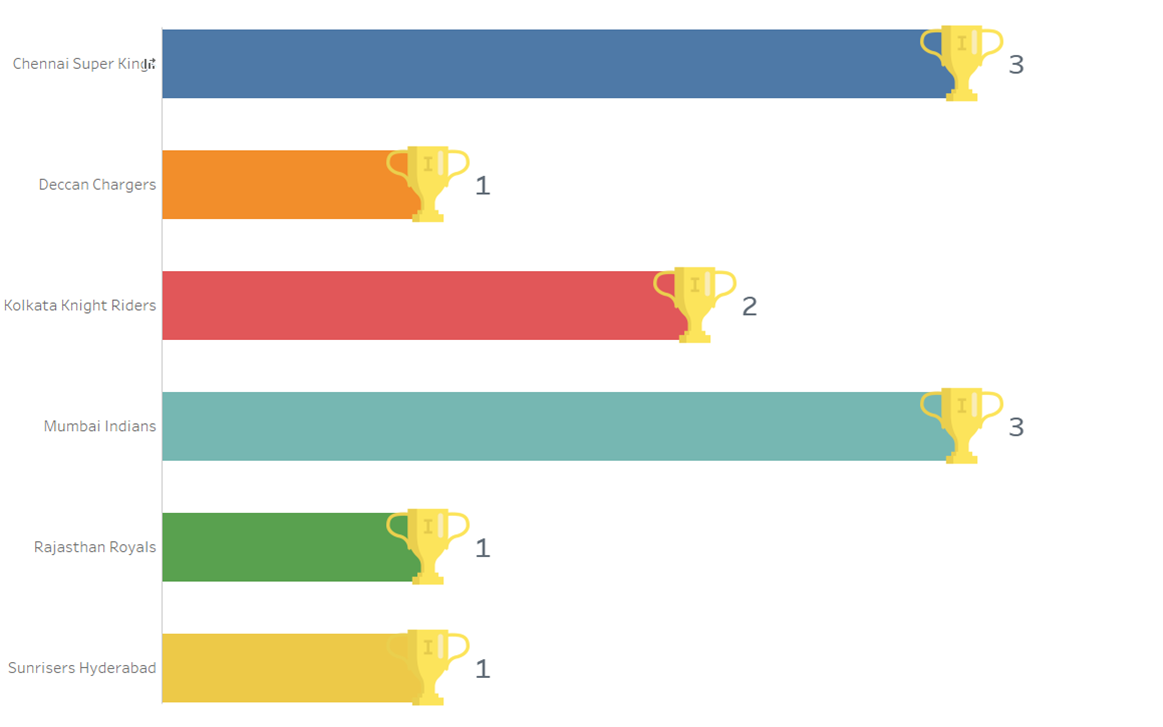
IPL Champions?
Chennai Super Kings and Mumbai Indias won the IPL Championships for the three times. Kolkata Knight Riders won the championship for two times. There are twelve teams in the dataset. Out of 12, only six teams won the championship. The championship has never been won by Royal Challengers, Delhi Daredevils, King XI Punjab, Pune Warriors, Gujarat Lions and Kochi Tusker.
How many matches were played in each stadium?
As per the below lollipop graph, M Chinnaswamy stadium has conducted the highest number of matches (76)followed by Eden Gardens, Feroz stadium and Wankhede stadium.

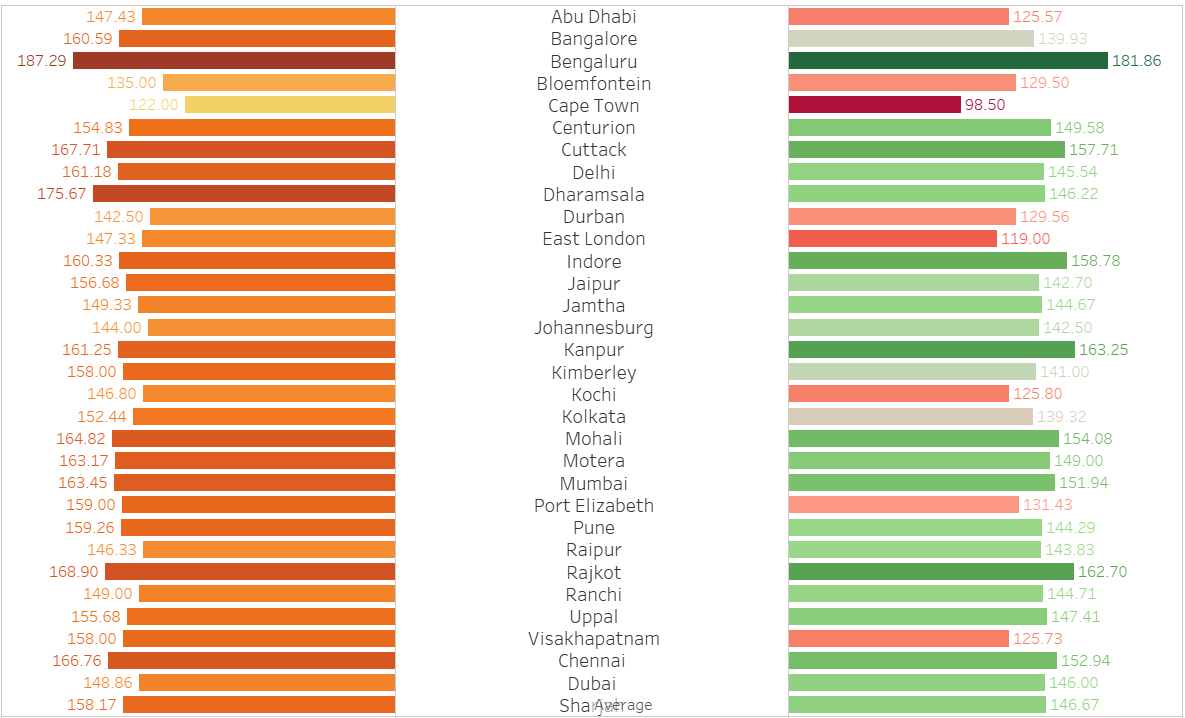
What are the average scores in each city?
The following butterfly chart shows that the highest scores achieved in Bengaluru followed by Dharamsala and Rajkot. It obviously shows favouring the batting pitch of these cities.
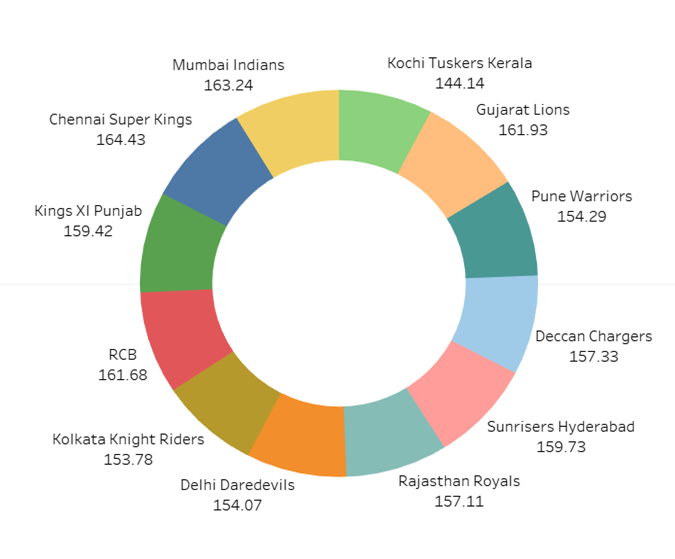
What is the average Team 1_ score?
As per the donut chart, Chennai Super Kings and Mumbai Indians had attained high scores when they batting first.
What is the team scores in IPL Finals — Batting first?
Sunrisers Hyderabad holds the highest score in the IPL finals followed by Chennai Super Kings and Mumbai Indians. Mumbai Indians holds the lowest score in the IPL finals for two seasons followed by Deccan Chargers.

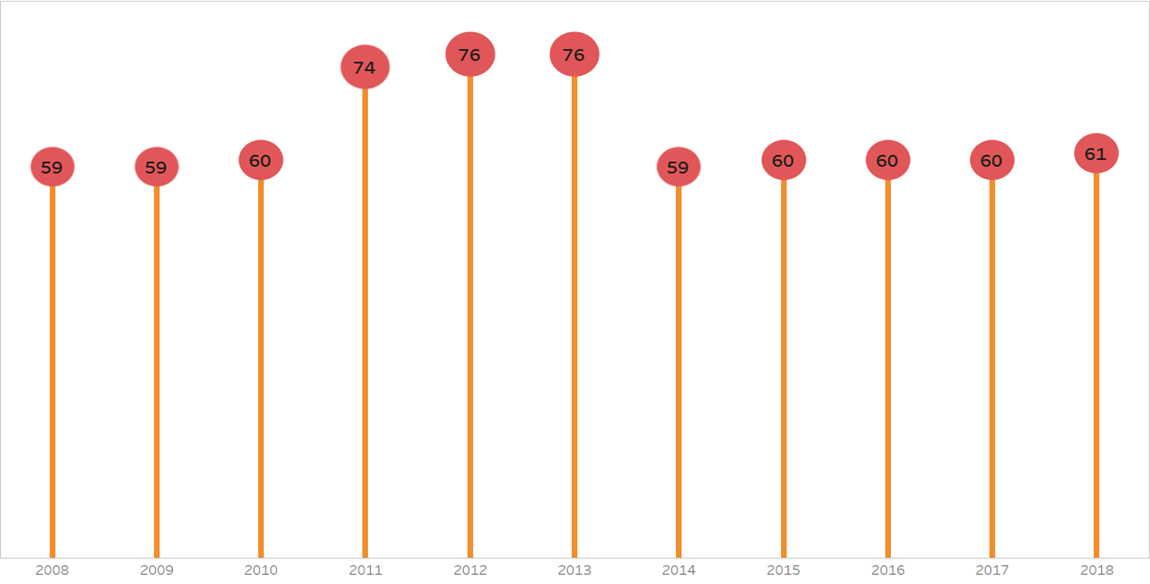
How many matches conducted in each season?
The lollipop graph indicates the highest number of matches happened in the 2012 & 2013 season followed by the 2011 season.
What is the Team’s lowest and highest score in each season?
The following two charts show an individual team’s lowest and highest scores in the IPL history. Delhi daredevils hold the lowest scores (56) in two seasons 2008 & 2011. Kolkata Night Riders hold 67 in 2008 and Royal challengers hold 56 in 2011.
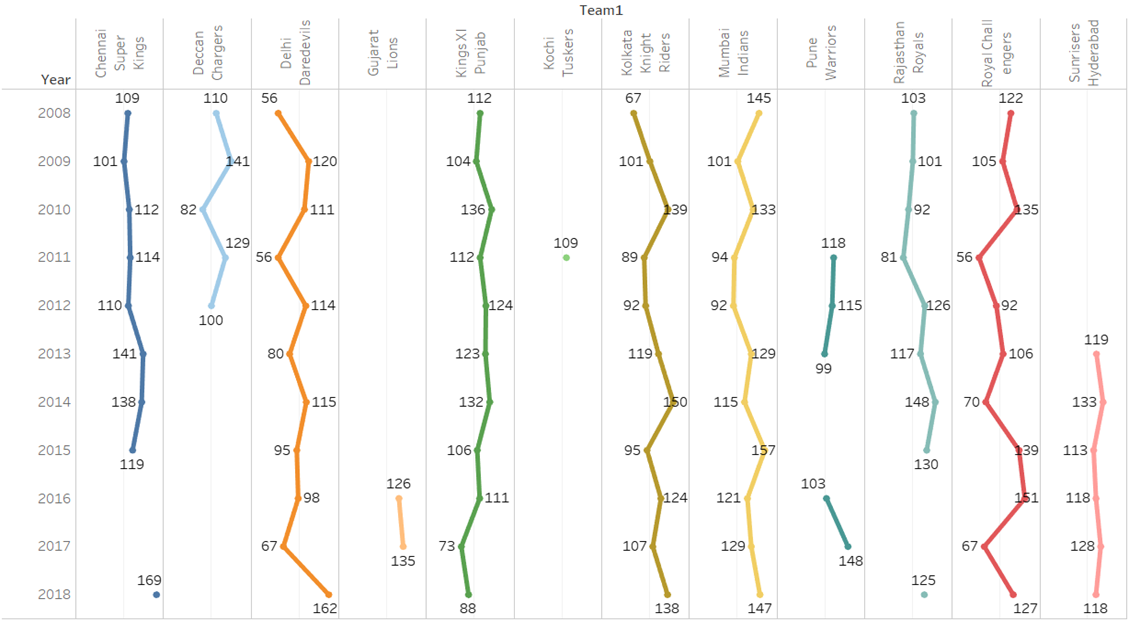
Royal Challengers hold the highest score in the IPL history of 263 & 248 in the year 2013 and 2016.

Most successful IPL Team?
Chennai Super Kings is the most successful team in IPL history. They are three times champions, five times Runners-up and two times qualified for Playoffs despite a two-year suspension.

The above visualizations were created in Tableau and only a preliminary one. However, more can be achieved. You can find all the visualizations here