Decision Tree in Layman’s Terms


What is Decision Tree?
A decision tree is a graphical representation of all the possible solutions to a decision based on certain conditions. Tree models where the target variable can take a finite set of values are called classification trees and target variable can take continuous values (numbers) are called regression trees.
Let’s take a real-life example,
Whenever you dial the toll-free number of your bank, it redirects you to their smart computerized assistant where it asks you series of questions like press 1 for English or press 2 for Spanish etc. Once you select the desired one, it again redirects you to a certain series of questions like press 1 for a loan, press 2 for a savings account, press 3 for credit card etc. This keeps on repeating until you finally get to the right person or service. You can think this is a just a voice mail process but actually, the bank was implemented decision tree to get you into the right product or service.
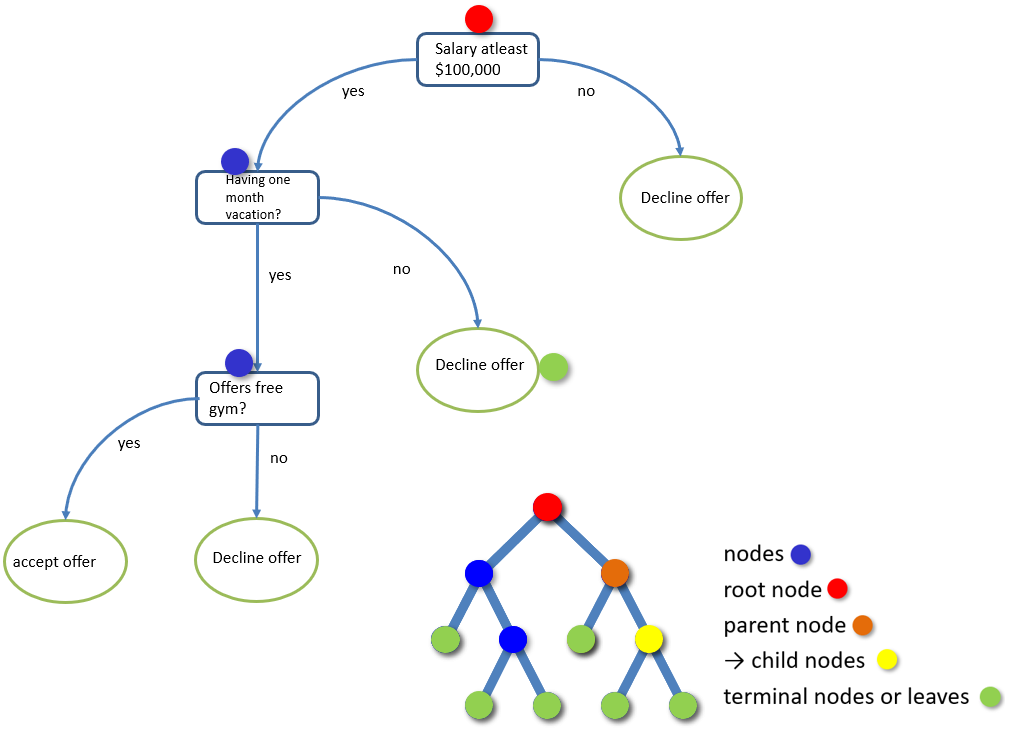
Consider the above picture, whether I should accept a new job offer or not? For that, we need to create a decision tree starting with the base condition or the root node (in blue colour) was that the minimum salary should be $ 100,000 if it has not $ 100,000 then you are not accepting the offer. So, if your salary is greater than 100,000 then you will further check whether the company is giving one-month vacation or not? If they are not giving then you are declining the offer. If they are giving a vacation, then you will further check whether the company is offering a free gym? If they are not providing free gym then you are declining the offer. If they are providing free gym then you are happily accepting the offer. This is just an example of a decision tree.
OK, how to build the tree?
There are many specific decision-tree algorithms are available. Notable ones include:
- ID3 (Iterative Dichotomiser 3)
- CART (Classification And Regression Tree)
- Chi-square automatic interaction detection (CHAID). Performs multi-level splits when computing classification trees.
In this blog, we will see ID3. There are three commonly used impurity measures used in decision trees: Entropy, Gini index, and Classification Error. Decision tree algorithms use information gain to split a node. Gini index or entropy is the criterion for calculating information gain. Gini index used by CART algorithm and Entropy used by ID3 algorithm. Before getting into the details, let’s read about impurity.
What is Impurity?

Suppose if you have a basket full of apples and another bowl contains full of the same label called Apple. If you are asked to pick one item from each basket and bowl, then the probability of getting the Apple and it’s the correct to label is 1 so in this case, you can say that impurity is 0

Suppose now there are three different fruits in the basket and three different labels in the bowl then the probability of matching the fruit to a label is obviously not 1, it’s something less than that. It could be possible that if we pick a banana from the basket and randomly pick a label from the bowl it says grapes. So here, any random permutation and the combination can be possible. In this case, we can say that impurity is not zero.
Entropy
Entropy is an indicator of how messy your data is.

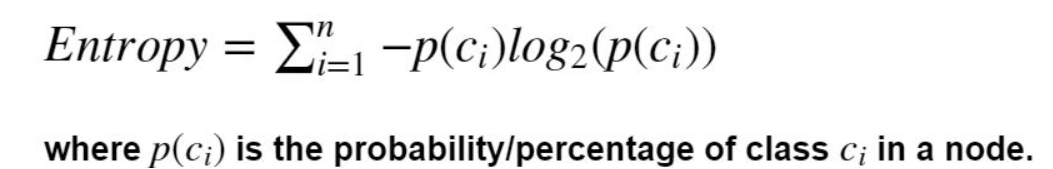
Entropy is the measure of randomness or unpredictability in the dataset. In other terms, it controls how a decision tree decides to split the data. Entropy is the measure of homogeneity in the data. Its value ranges from 0 to 1. The entropy is 0 if all samples of a node belong to the same class (not good for training dataset), and the entropy is maximal if we have a uniform class distribution (good for training dataset). The equation of entropy is
Information Gain
Information gain (IG) measures how much “information” a feature gives us about the class. The information gain is based on the decrease in entropy after a dataset is split on an attribute. It is the main parameter used to construct a Decision Tree. An attribute with the highest Information gain will be tested/split first.
Information gain = base entropy — new entropy
Let’s take an example of below cartoon dataset. Thanks to Minsuk Heo for sharing this example. You can check his youtube channel here


The dataset has a cartoon, winter, >1 attributes. Family winter photo is our target. Total 8 pictures. We need to teach baby to pick the correct winter family vacation photo.
How to split the data?
We have to frame the conditions that split the data in such a way that the information gain is the highest. Please note gain is the measure of the decrease in entropy after splitting. First, will calculate the entropy for the above dataset.
Total of 8 photos. Winter family photo — 1 (Yes), Now winter family photo — 7 (No). If we substitute in the above entropy formula,
= -(1/8) * log2(1/8) — (7/8) * log2(7/8)
Entropy = 0.543
We got three attributes namely cartoon, winter and >1. So which attribute is a best for building a decision tree? We need to calculate information gain for all three attributes in order to choose the best one or root node. Our base entropy is 0.543
Information Gain for a cartoon, winter,
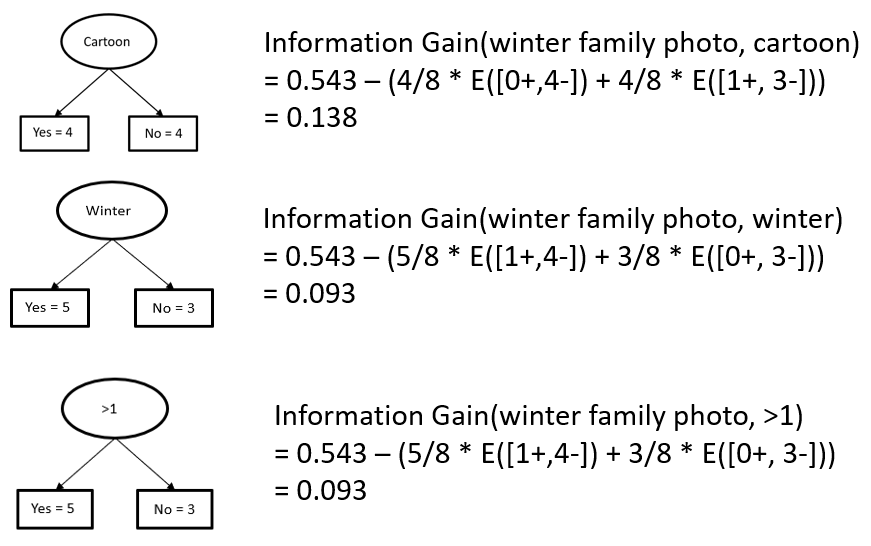
Cartoon has high information gain, so the root node is a cartoon character.
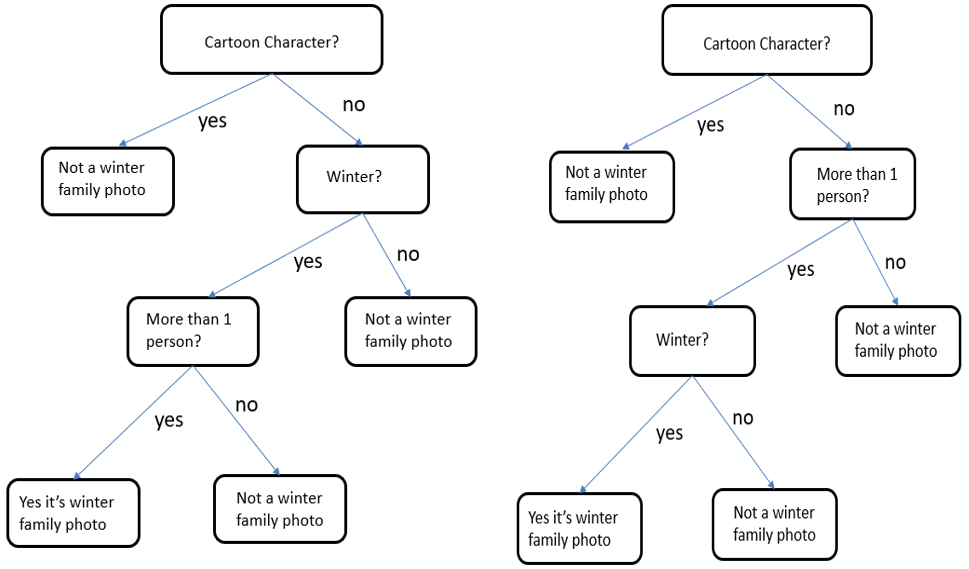
The root node is a cartoon character. We need to split again based on the other two attributes winter or >1. Calculate again information gain and choose the highest one for selecting the next split.
> 1 attribute has a high information gain, split the tree accordingly. Final tree as follows

Pros of Decision Tree
- Decision trees are easy to visualize and interpret.
- It can easily capture non — linear patterns.
- It can handle both numerical and categorical data.
- Little effort required for data preparation. (example, no need to normalize the data)
Cons of Decision Tree
- Overfitting is one of the most practical difficulties for decision tree models.
- Low accuracy for continuous variables: While working with continuous numerical variables, decision tree loses information when it categorizes variables in different categories.
- It is unstable, meaning that a small change in the data can lead to a large change in the structure of the optimal decision tree.
- Decision trees are biased with the imbalanced dataset, so it is recommended that balance out the dataset before creating the decision tree.
I will explain the CART algorithm and overfitting issues using Python in my next article.
Keep learning and stay tuned for more!
If you find any mistakes or improvements required, please feel free to comment below.