Building simple Business Intelligence Project using Azure Synapse and Power BI


Spotify Data Analysis using Synapse and Power BI
In this article, I created a very simple end-end-end Business Intelligence (BI) project using Azure Synapse and Power BI. But, before that, what is BI? In short, BI is a process of collecting, storing, analyzing, and converting raw data into actionable insights which help organizations make better data-driven decisions.
This project was created using Azure Synapse analytics and used Spotify dataset. Azure Synpase is a unified platform which ingest, explore, prepare, transform, manage, and serve data for immediate BI and machine learning needs.
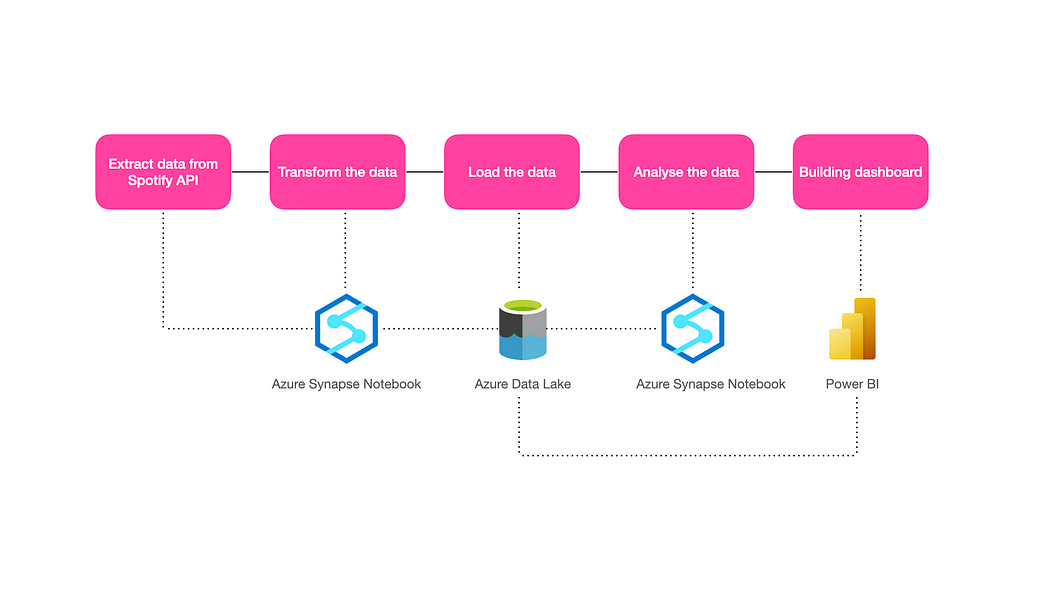
Below are the steps followed in this project (please refer to above),
- Extracted data from Spotify API through Azure Synapse notebook (powered by Apache Spark)
- Transformed the data again using Synapse notebook
- Loaded the data into Azure Data Lake from the Synapse notebook
- Analysed the data using Synapse notebook
- Connected the data into Power BI from the data lake and built the Dashboard.
We can also use the Azure Synpase pipeline for extracting the data instead of a notebook. However, I used a notebook in this project.
Here, I copied the code from my Synapse notebook and pasted it into this article as there is no option for embedding the synapse notebook into the medium. Taking notebook screenshots is not good for reading.
This article won’t cover how to create a Synapse Notebook in Azure or any cloud concepts. Please check here for how to create a Synapse notebook.
Prerequisites
- Spotify ClientID and Client Secret
- Azure Synapse Subscription
- Power BI desktop
- Basic cloud knowledge
1) Extracting the data from Spotipy API
The first step is to get the ClientID and Client Secret from Spotify. For that, we need to signup at the Spotify website and create an app to grab the ClientID and Client Secret.
Spotify provides SpotiPy API as a wrapper, and it is very easy to extract the data.
In Synapse Notebook, we can add the external python library through a text file and upload it as a package in the spark pool. I named the text file requirements.txt and added the library name. Please check the documentation. Also, we need to create a spark pool (used for compute capabilities) for running the synapse notebook. Please check here how to create a spark pool in synapse studio.
Import spotipy library and initialise the spotipy and provide your ClinetID and Client Secret stored in a variable called client_id and client_secret
# Import spotipy and initialise

import spotipy
from spotipy.oauth2 import SpotifyClientCredentials
client_id = 'YOUR SPOTIFY CLIENT ID'
client_secret = 'YOUR SPOTIFY CLIENT SECRET ID'
client_credentials_manager = SpotifyClientCredentials(client_id, client_secret)
sp = spotipy.Spotify(client_credentials_manager=client_credentials_manager)
Import other necessary libraries and used Plotly for the visualization.
# Import necessary library

import pandas as pd
import numpy as np
import chart_studio.plotly as py
import chart_studio.tools as tls
import plotly.express as px
from plotly.offline import init_notebook_mode, iplot
init_notebook_mode(connected=True)
import plotly.graph_objs as go
import chart_studio
Spotify API provides tracks, artists and track features. First, we extracted the track and artist features. Then, we extracted the track features and merge them into one dataset.
Getting Track features
Spotipy provides a sp.search() method for querying the track features. Please check the documentation here. Please note we can only have a maximum of 50 tracks at a time and can have a max of 1000 records. I am very interested to see the data pertains to an Indian market, and hence I have extracted only pertains to India. We need to mention the country code in the market parameter in the search query. For more details on the market code, please check here.
# Creating an empty lists for track features

artist = []
track = []
track_popularity = []
artist_id = []
track_id = []
length = []

#Quering Track features

for i in range(0,1000,50):
# Market = 'IN' -> IN is India
tracks = sp.search(q='year:2022', type = 'track', market = 'IN', limit = 50, offset = i)
for i, j in enumerate(tracks['tracks']['items']):
    artist.append(j['artists'][0]['name'])
    artist_id.append(j['artists'][0]['id'])
    track.append(j['name'])
    track_id.append(j['id'])
    track_popularity.append(j['popularity'])
    length.append(j['duration_ms'])
Convert the track features into a data frame
# Store in the dataframe

df = pd.DataFrame({'Artist' : artist, 'Track' : track, 'Track_id' : track_id, 'Track_popularity' : track_popularity, 'Artist_id' : artist_id, 'Length' : length})
print(df.shape)
df
Getting Artist features
Now, we need to add the artist features for the above tracks we extracted. API provides three artist features Artist popularity , generes and followers
# Creating an empty list for artist features

artist_popularity = []
genres = []
followers = []
for i in artist_id:
    artist = sp.artist(i)
    artist_popularity.append(artist['popularity'])
    genres.append(artist['genres'])
    followers.append(artist['followers']['total'])

#Assigning the above features into dataframe 'df'

df = df.assign(Artist_Popularity = artist_popularity, Genres = genres, Followers= followers)
df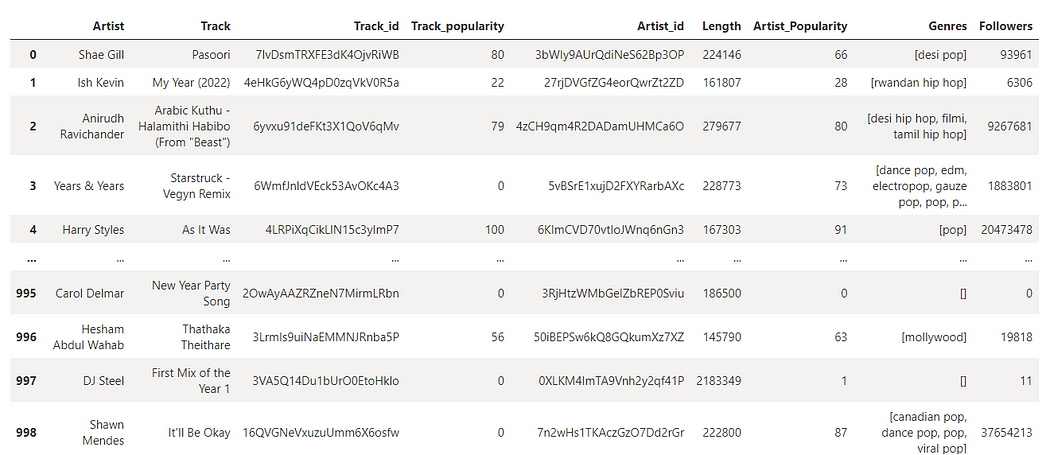
Extracting Track numerical features
Last, extracted the numerical features of the above tracks. It is easy and simple to get these numeric features. Please check the documentation for the features details. Intresting to see these features danceability, energy, loudness, speechiness, acousticness, liveness, valence and tempo .
#Creating a empty list

track_features = []

#Extracting the track features by looping into track id and creating a new dataframe called "tfeatures"

for i in df['Track_id']:
    feature = sp.audio_features(i)
    track_features.append(feature)
tfeatures = pd.DataFrame(columns = ['danceability', 'energy', 'key', 'loudness', 'mode', 'speechiness', 'acousticness', 'instrumentalness', 'liveness', 'valence', 'tempo', 'type', 'id', 'uri', 'track_href', 'analysis_url', 'duration_ms', 'time_signature'])

for j in track_features:
    for k in j:
        tfeatures = tfeatures.append(k, ignore_index=True)
tfeatures.head()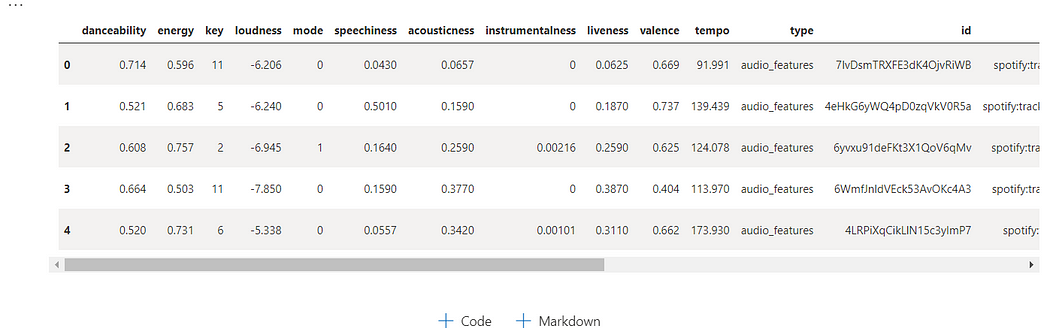
We finished extracting the data from the API. The next step is to transform the data.
2) Transform the data
Did small transformation as below,
- Merged the Track, Artist and track numerical features into a single data frame.
- Dropped the unwanted columns.
- Capitalized the Artist and Track feature; also changed the datatype.
- Converted duration columns into minutes from milliseconds.
# Merging Track and Audio Features and stored in 'df1'

df1 = pd.merge(df, tfeatures, how = 'inner', left_on = 'Track_id', right_on = 'id')

# Dropping the unwanted features

df1 = df1[['Artist', 'Track', 'Track_id', 'Track_popularity', 'Artist_id','Artist_Popularity', 'Genres', 'Followers', 'danceability','energy', 'key', 'loudness', 'mode', 'speechiness', 'acousticness','instrumentalness', 'liveness', 'valence', 'tempo', 'duration_ms']]

#Capitalizing the Artist and Track

df1['Artist'] = df1['Artist'].str.capitalize()
df1['Track'] = df1['Track'].str.capitalize()
# Changing the data type
df1['key'] = df1['key'].astype(int)
df1['mode'] = df1['mode'].astype(int)
df1['instrumentalness'] = df1['instrumentalness'].astype(float)
df1['duration_ms'] = df1['duration_ms'].astype(int)

# Duration_ms in milliseconds. Convert into minutes

df1['duration_ms'] = df1.apply(lambda x: round(x['duration_ms']/60000,2), axis=1)
3) Loading the data into Azure Data Lake
Stored the data frame df1 into Azure Data Lake as a CSV file called spotify.csv
We need to write our spotify.csv into Data Lake, and it is very simple & straightforward with one line of code. Please note you need to have to write permission to save the data into a data lake.
abfss://your_container_name@your_storage_account_name.dfs.core.windows.net/filepath
Here, my container name spotify and my storage account name is storagegen2dstest
# Saving the Spotify.csv into the data lake.

df1.to_csv('abfss://spotify@storagegen2dstest.dfs.core.windows.net/spotify.csv', sep=',', encoding='utf-8', index=False)
We finished loading the data into a data lake. Now, we can start doing our analysis. You can directly begin analysis without saving the data into a data lake; however, I would like to keep it as I want to connect with Power BI later. Also, we can automate the above extraction, transformation and load as data gets changed every day in Spotify.
4) Analyzing the data
I wanted to find the answer to the below questions,
How many Indian songs are on the Top 10 list?
What are the top 10 least popular songs?
What are the top 10 genres? What is the percentage of songs in the Pop category?
What are the top 15 artists by followers? Are any Indian artists there?
Which song is the best to dance to?
Identify 5 artists with more than one song in the dataset
Is there any relationship between the audio features?
Reading our CSV from the data lake.
df1 = pd.read_csv('abfss://spotify@storagegen2dstest.dfs.core.windows.net/spotify.csv')How many Indian songs are on the Top 10 list?
# Sorting the dataframe by Track_popularity

df1.sort_values('Track_popularity', ascending = False, inplace = True)

# taking the Track and track_popularity and store in a seperate dataframe called "top"

top = df1[['Track', 'Track_popularity']]
top = top.head(15)

# Building visuals

fig = px.bar(top, x='Track', y="Track_popularity", orientation = 'v', title = "Top 10 most popular song",labels={"Track": "Track",
"Track_popularity": "Track Popularity"}
)
fig.show()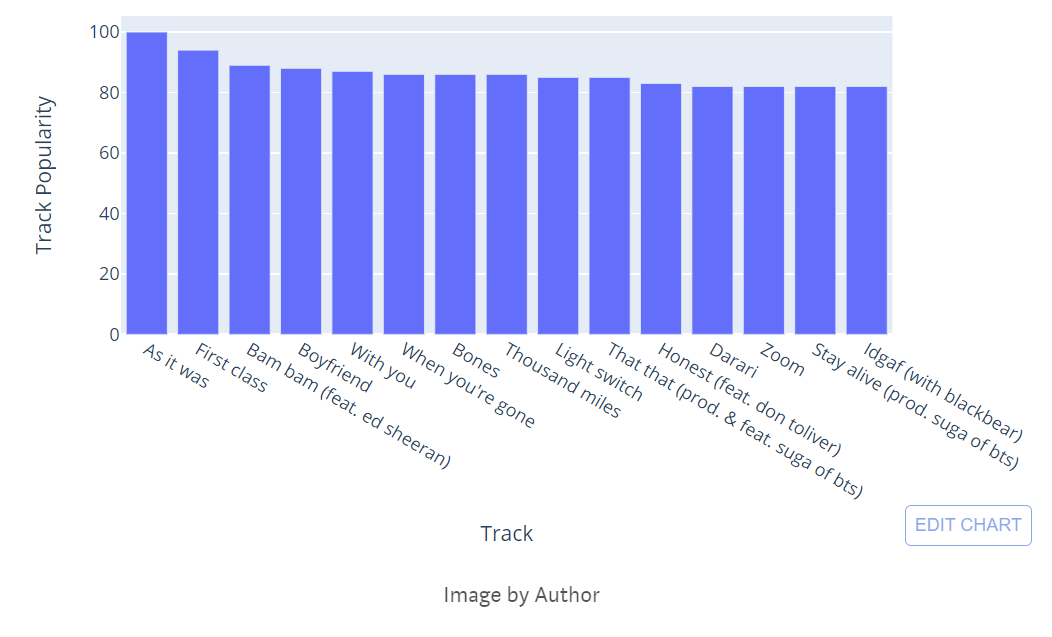
Our data pertained to Indian Market. I don’t see any Indian songs in the top 10 list.
What is the least popular song?
#Sorting the dataframe by Track_popularity

df1.sort_values('Track_popularity', ascending = True, inplace = True)
top = df1[['Track', 'Track_popularity', 'Artist']]
top = top.head(10)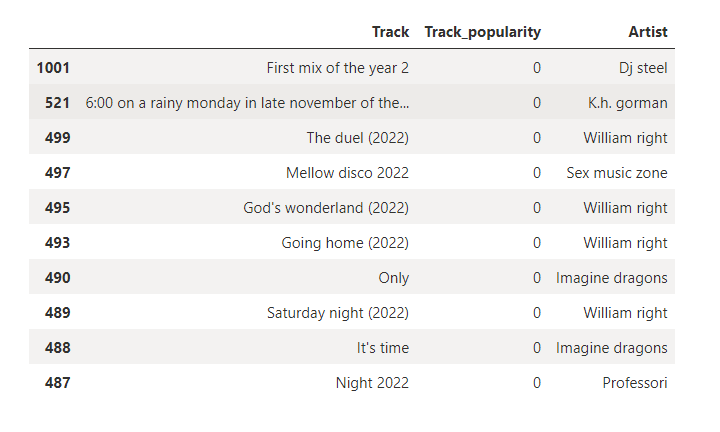
Interesting, there are no Indian songs in the top 10 least list as well.
Group the songs by genre How many songs are there in the pop category?
# Taking track, Track_id, genre and store in a new dataframe called genre

genre = df1[['Track', 'Track_id', 'Genres']]
genre = genre.explode('Genres')
genre['Genres'] = genre['Genres'].str.capitalize()
genre = genre.groupby('Genres')['Track_id'].count()
genre = genre.to_frame().reset_index()
genre.sort_values('Track_id', ascending = False, inplace = True)
genre = genre.head(10)

#Building Visuals

fig = px.pie(genre, values= 'Track_id', names = 'Genres', title = "Top Genres by total songs", color_discrete_sequence=px.colors.sequential.RdBu)
fig.show()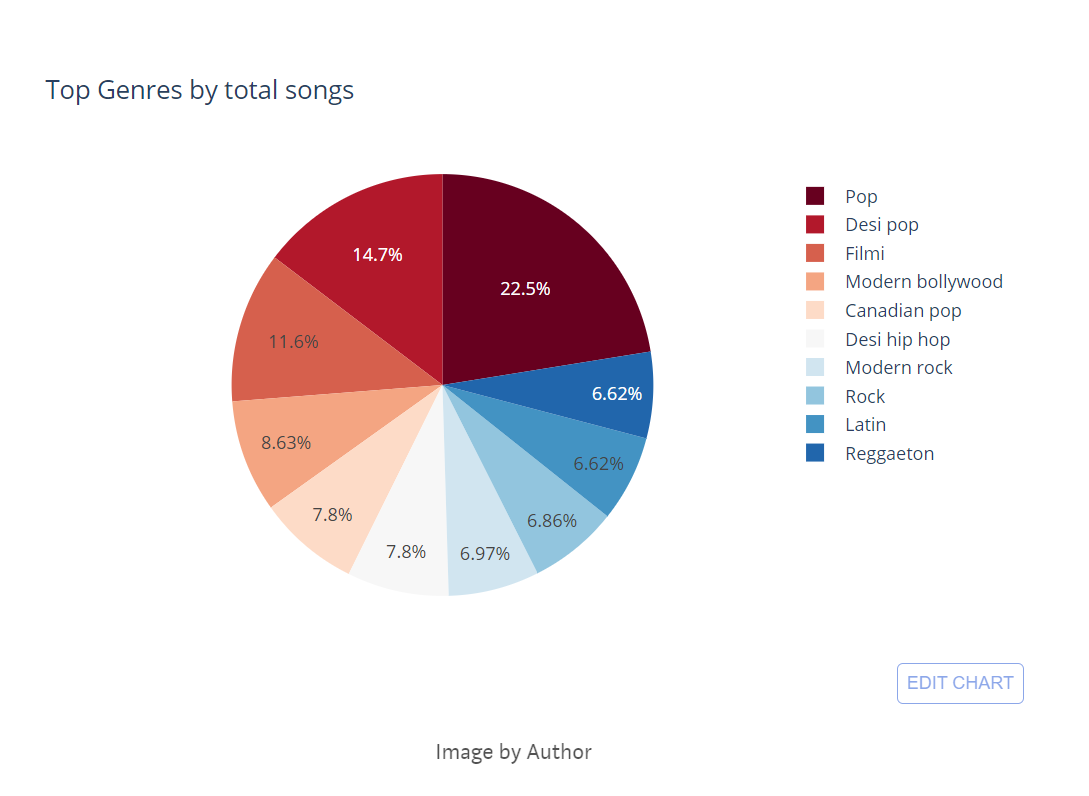
Pop is dominating the top 10 genres. Also, we can see a lot of Indian genres are on the list like Bollywood, desi hip hop, filmi etc. Close to 25% of songs belong to the ‘pop’ category.
Top 15 Artists by Followers
# Grouping the artist and finding top 15 by followers

followers = df1[['Artist', 'Followers']].groupby('Artist').sum().sort_values('Followers', ascending = False).head(15).reset_index()

#Building visuals

fig = px.bar(followers, y = "Followers", x = 'Artist', orientation = 'v', title = "Top 15 Artist by Followers",labels={"Artist": "Artist","Followers": "Total Followers"})
fig.show()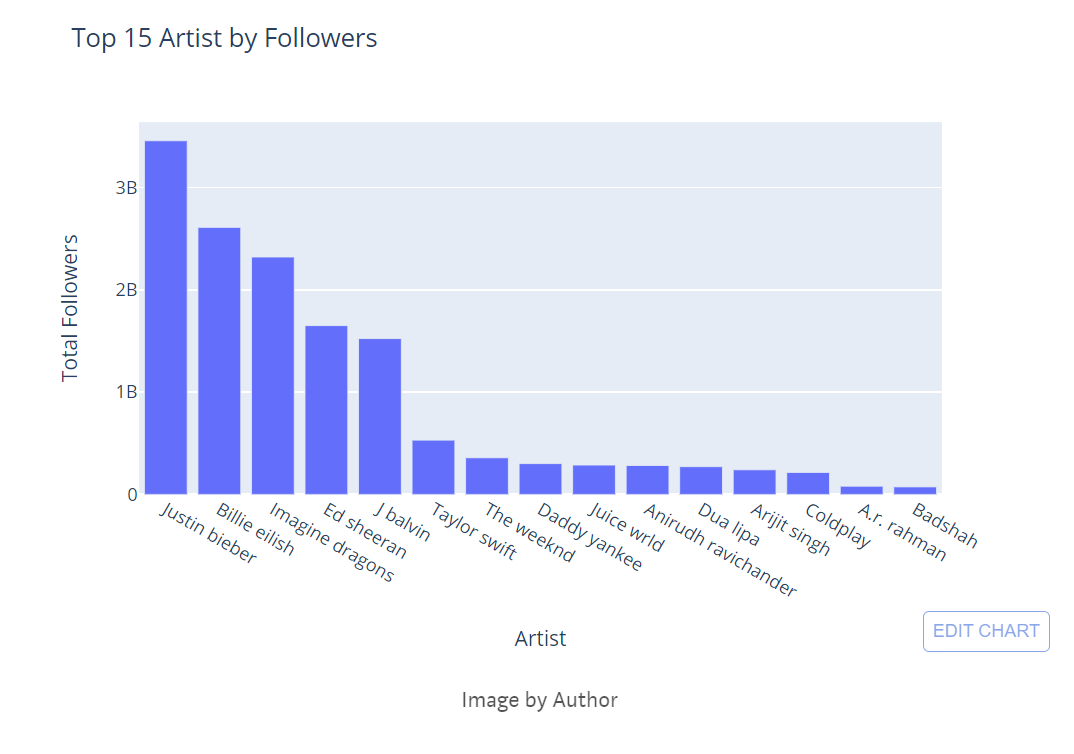
Not sure whether the artist's followers are calculated globally or pertain to each market. However, I can see two Indian artists like ‘Anirudh Ravichander & ‘A.R.Rahman’ in the top 15 list.
Which song is the best to dance to?
We can use the danceability feature to find which song is best to dance to. Danceability values are from 0 to 1. If the value is 0.0 then it is least danceable and 1 is most danceable.
# Finding top song for best to dance

dance = df1[['Track', 'danceability']].groupby('Track').mean().sort_values('danceability', ascending = False).head(15).reset_index()

# Building visuals

fig = px.bar(dance, x = 'Track', y = "danceability",  orientation = 'v', title = "Which song is the best to dance to?",labels={"Track": "Track","danceability": "Danceability"})
fig.show()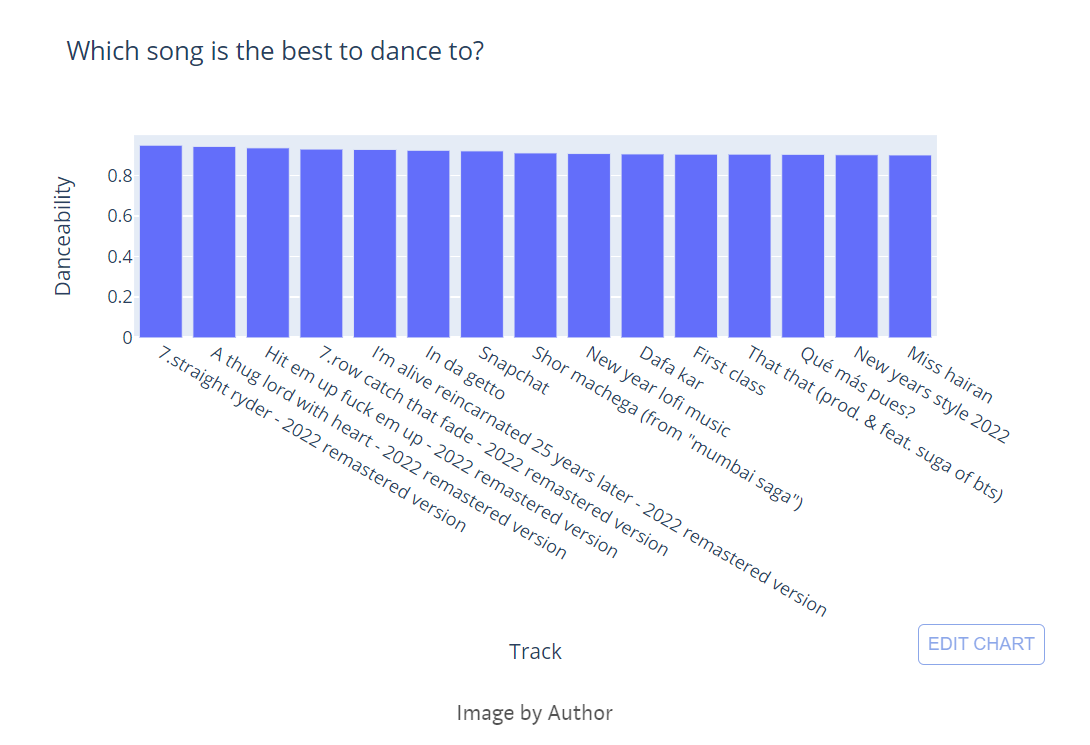
Indian song is available but not in the top 5.
Identify 5 artists with more than one song in the dataset
# Finding top 5 artists with more than one song

number = df1[['Artist', 'Track_id']].groupby('Artist').count().sort_values('Track_id', ascending = False).head(5).reset_index()
number.rename(columns = {'Track_id':'Total Songs'}, inplace = True)
colors=['#fae588','#f79d65','#f9dc5c','#e8ac65','#e76f51','#ef233c','#b7094c']
#color palette

# Building Visuals

fig = px.treemap(number, path=['Artist'],values='Total Songs', title = "Top 5 artists with more than one song", width=800, height=400)
fig.update_layout(treemapcolorway = colors, #defines the colors in the treemap margin = dict(t=50, l=25, r=25, b=25))
fig.show()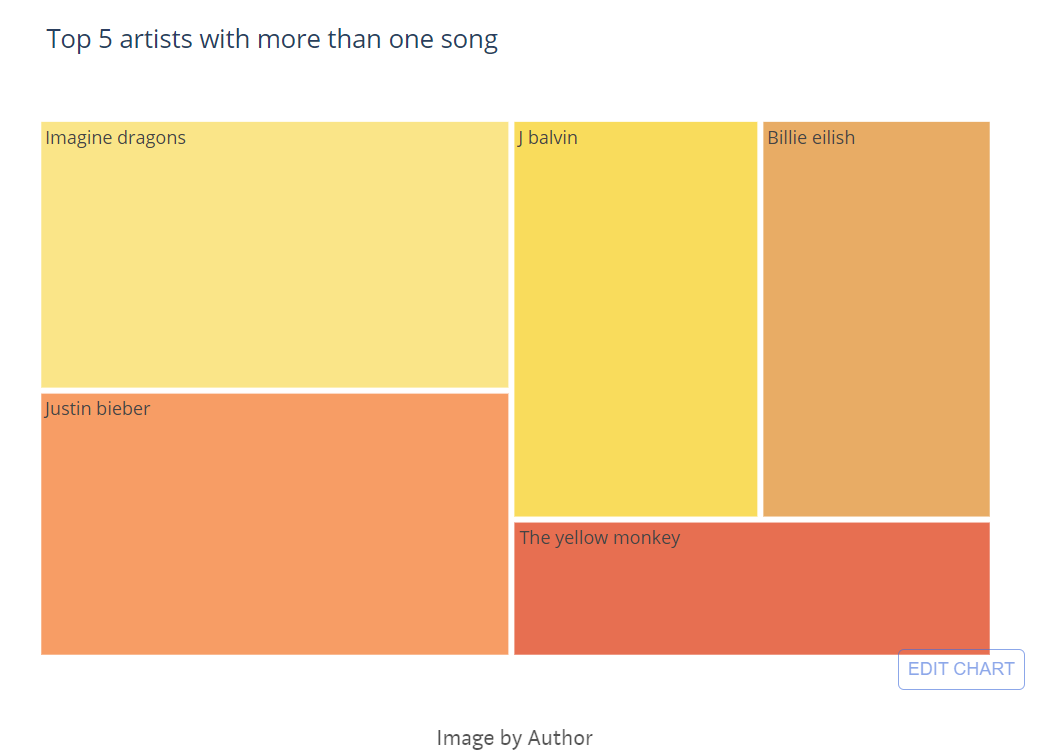
I can see one Indian artist (Anirudh Ravinchander) in the Top 5 list.
Correlation Matrix for Track Features
# Separating features from the dataframe

features = df1[['danceability', 'energy','loudness', 'mode','speechiness', 'acousticness','instrumentalness', 'liveness', 'valence', 'tempo', ]]

# Finding correlation

df = features.corr()

#Building Visuals

fig = go.Figure()
fig.add_trace(go.Heatmap(x = df.columns,y = df.index,z = np.array(df),text=df.values,texttemplate='%{text:.2f}'))
fig.update_layout(width = 800, height = 800,title = "Correlation Matrix for Track Features", coloraxis1=dict(colorscale="Plasma"))
fig.show()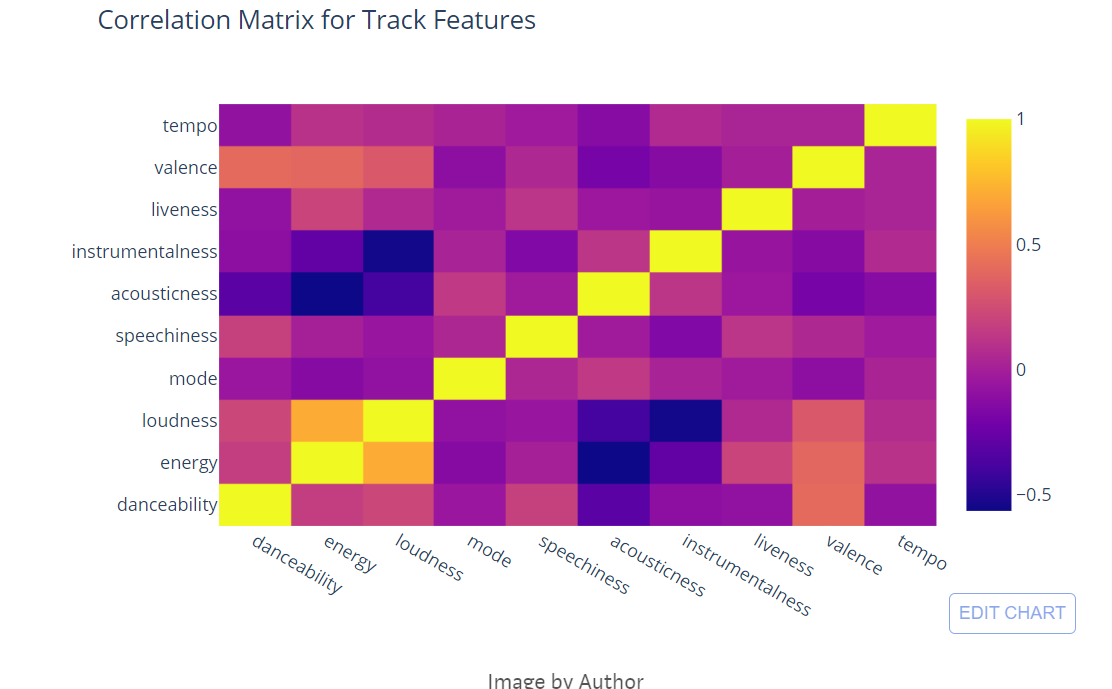
Correlation matrix among the audio features. I don’t see any high correlation among the features and also see negative correlations.
The above results are dynamic as everyday data gets changed in the Spotify API based on the user.
I have done the entire above analysis in the Azure Synapse notebook. As I mentioned, there is no option for embedding a synapse notebook into the medium. Taking a picture of the synapse notebook here won’t be easy to read. Hence, I have just copied the code in this article.
Building Power BI Report
This is an interesting dataset to tell a story. I just connected the CSV file from the data lake to Power BI and built the simple report. You can check interactive link here.
We can use other cloud platforms as well to execute the above project. I just used Azure as I am predominantly working day to day basis. We can use Python, MySQL and Power BI if it is an on-premise solution.
Thanks for reading.